Chapter 6 Basic Statistics Math 10th Class Federal MCQ Tests
10th Class Math Chapter 6 MCQ Tests
Chapter 6 of 10th Class Math has 20 questions. If you take an online MCQ test, the system will randomly choose the questions. If you want to take the quiz by chapter then click the start test button.
Total Questions: 20
Total Marks: 20
Time: 20 Mins
Total Questions: 20
Total Marks: 20
Time: 20 Mins
20Min : 00 Sec Remaining
Question # 1
Suppose that we have observed the following n = 5 resting pulse rates: 64 , 68 , 74 , 76 , 78 . Find the standard deviation.
Question # 2
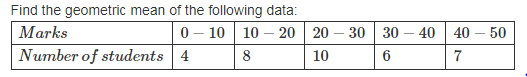
Find the geometric mean of the following data:
Question # 3
Cumulative frequency distribution which is 'greater than' type is correspondent to _____.
Question # 4
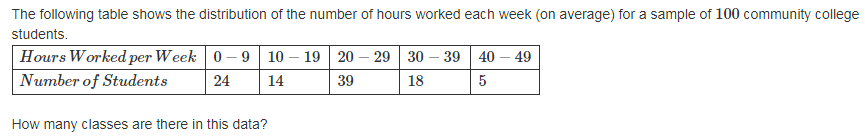
The following table shows the distribution of the number of hours worked each week (on average) for a sample of 100 community college students. How many classes are there in this data?
Question # 5
Histogram and frequency polygon are two graphical representations of:
Question # 6
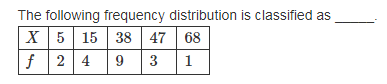
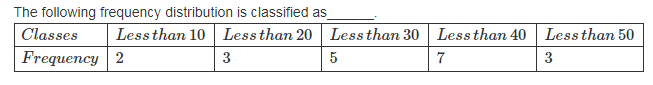
The following frequency distribution is classified as _____.
Question # 7
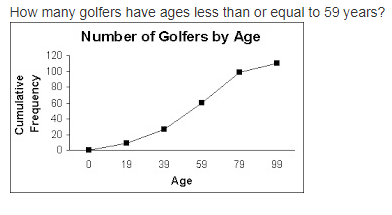
How many golfers have ages less than or equal to 59 years?
Question # 8
If scatter or dispersion in distribution is high on each side then this indicates
Question # 9
Find the mode of the values 5 , 7 , 2 , 9 , 7 , 10 , 8 , 5 , 7.
Question # 10
A chemistry experiment calls for a 30 % solution of copper sulfate. Kendra has 40 milliliters of 25 % solution. How many milliliters of 60 % solution should she add to make a 30 % solution?
Question # 11
Each of the nine friends guessed the number of marbles in a jar. When the answer was revealed they found they had guessed well (and one was the winner!) Here is how close they each got: − 9 , − 7 , − 4 , − 1 , 0 , 2 , 7 , 9 , 12 (A negative number shows an underestimate, a positive number shows an overestimate.) What was the standard deviation of their errors?
Question # 12
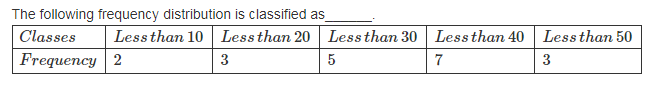
The following frequency distribution is classified as______.
Question # 13
Find the Standard Deviation of 6 , 7 , 10 , 11 , 11 , 13 , 16 , 18 , 25.
Question # 14
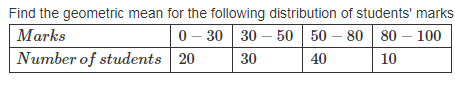
Find the geometric mean for the following distribution of students' marks:
Question # 15
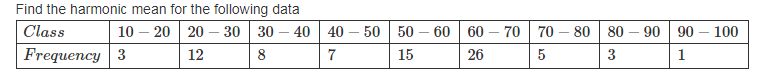
Find the harmonic mean for the following data
Question # 16
The following frequency distribution is classified as______.
Question # 17
A sample of college students was asked how much they spent monthly on a cell phone plan (to the nearest dollar).
It is an example of _____ data.
Question # 18
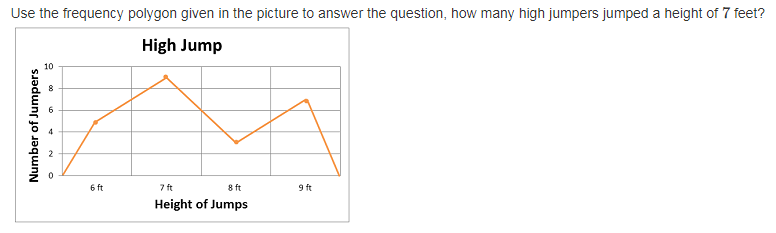
Use the frequency polygon given in the picture to answer the question, how many high jumpers jumped a height of 7 feet?
Question # 19
Find out the variance for the following data representing the age group of employees working in X Y Z company.
Question # 20
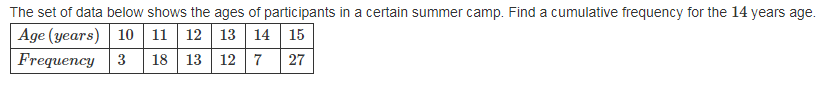
The set of data below shows the ages of participants in a certain summer camp. Find a cumulative frequency for the 14 years age.
Total Questions
1234567891011121314151617181920
Question # 1
Suppose that we have observed the following n = 5 resting pulse rates: 64 , 68 , 74 , 76 , 78 . Find the standard deviation.
Question # 2
Find the geometric mean of the following data:
Question # 3
Cumulative frequency distribution which is 'greater than' type is correspondent to _____.
Question # 4
The following table shows the distribution of the number of hours worked each week (on average) for a sample of 100 community college students. How many classes are there in this data?
Question # 5
Histogram and frequency polygon are two graphical representations of:
Question # 6
The following frequency distribution is classified as _____.
Question # 7
How many golfers have ages less than or equal to 59 years?
Question # 8
If scatter or dispersion in distribution is high on each side then this indicates
Question # 9
Find the mode of the values 5 , 7 , 2 , 9 , 7 , 10 , 8 , 5 , 7.
Question # 10
A chemistry experiment calls for a 30 % solution of copper sulfate. Kendra has 40 milliliters of 25 % solution. How many milliliters of 60 % solution should she add to make a 30 % solution?
Question # 11
Each of the nine friends guessed the number of marbles in a jar. When the answer was revealed they found they had guessed well (and one was the winner!) Here is how close they each got: − 9 , − 7 , − 4 , − 1 , 0 , 2 , 7 , 9 , 12 (A negative number shows an underestimate, a positive number shows an overestimate.) What was the standard deviation of their errors?
Question # 12
The following frequency distribution is classified as______.
Question # 13
Find the Standard Deviation of 6 , 7 , 10 , 11 , 11 , 13 , 16 , 18 , 25.
Question # 14
Find the geometric mean for the following distribution of students' marks:
Question # 15
Find the harmonic mean for the following data
Question # 16
The following frequency distribution is classified as______.
Question # 17
A sample of college students was asked how much they spent monthly on a cell phone plan (to the nearest dollar).
It is an example of _____ data.
Question # 18
Use the frequency polygon given in the picture to answer the question, how many high jumpers jumped a height of 7 feet?
Question # 19
Find out the variance for the following data representing the age group of employees working in X Y Z company.
Question # 20
The set of data below shows the ages of participants in a certain summer camp. Find a cumulative frequency for the 14 years age.
Total Questions
1234567891011121314151617181920
Math MCQ Test by Topics
- +6.1 Frequency Distribution
- +6.2 Cumulative Frequency Distribution
- +6.3 Measures of Central Tendency
- +6.4 Meassures of Dispersion
Math
10th Class Federal MCQ Tests


10th Class Online Classes 2026
Updated on: 17-05-2026
10th Class Online Preparation
10th Class 2026 Online
10th Class 2026
Add a Comment
Comments will be shown after admin approval.
Spam comments will not be approved at all.
Matric Result 2026 Punjab
10th Class Result 2026 Punjab
9th Class Result 2026 Punjab Boards
10th Class Result Gazette 2026 Punjab
Punjab Past Papers Matric 9th 10th
Primary Results 5th & 8th Class
BISE Results Intermediate & Matric
BISE Punjab Boards
Sindh Educational Boards
KPK Examination Boards
Technical Boards
Public Service Commission
University Results Gruaduation, Masters Classes
Subscribe by Email
Subscribe by Email
Subscribe to Rss Feed
Position Holders Matric 2026
Position Holders 9th Class 2026
Position Holders Inter 2026
Position Holders 11th Class 2026
Federal 10th Class Math